Public health measures implemented to contain the spread of COVID-19 have caused a sharp contraction in economic activity. Today, we’re in the initial stages of a recession.
In Texas, the impact was compounded by a profound drop in energy prices that began at the beginning of March and now is being reinforced by a collapse in demand caused by the economic downturn. And while the full impacts are unclear, it’s apparent that Texas’ economy and revenue collections will be affected drastically.
Revenue projections for the state’s 2020-21 biennium can be expected to fall. At the same time, pressures on state finances are mounting as large numbers of Texans turn to Medicaid, unemployment insurance and other forms of public assistance. And any declines in the taxable value of property — a critical source of local funding for Texas public schools — may cause the state’s share of public education costs to increase.
Unique Economic Challenges
While most recessions are caused by changes either to demand or supply, the COVID-19 pandemic has caused shocks to both.
The pandemic has interrupted vital supply chains by slowing imports and by forcing domestic firms to close, lay off workers or reduce worker hours. “Social distancing” and other measures intended to mitigate the spread of COVID-19 have dealt major blows to consumer service industries worldwide, including travel, tourism, lodging, dining and recreation.
In Texas, the immediate effects are reflected in weekly initial claims for unemployment. Claims for the week ending March 21 surged by 860.8 percent over the prior week (Exhibit 1). To date, the number of weekly claims in Texas peaked in the week ending April 4, at more than 315,000. By contrast, Texas claims reached peaks of 50,000 in a week during the Great Recession of the late 2000s and 64,000 following Hurricane Harvey in 2017.
Due to lags in data collection and reporting, many official data sources aren’t yet reflecting the initial economic impacts of the pandemic. Other sources can add additional perspective, however.
Data from Homebase, for instance — a company that provides scheduling software to thousands of small to midsized businesses, predominantly in the services sector, which employ hourly workers — reflect how quickly this segment of the economy was affected (Exhibit 2).
EXHIBIT 2: PERCENTAGE CHANGE IN THE NUMBER OF HOMEBASE CLIENTELE OPEN FOR BUSINESS, IN THE U.S. AND TEXAS MSAs, MARCH 1, 2020 – MAY 14, 2020
Note: MSAs are metropolitan statistical areas as defined by the U.S. Census Bureau. Homebase clientele are primarily concentrated in the following sectors, as classified by Homebase — beauty and personal care; charities, education and membership; food and drink; health care and fitness; home and repair; leisure and entertainment; professional services; retail; transportation; and “other.”
Source: Homebase
The pandemic’s impact on the travel industry also can be tracked. Based on data from the Transportation Security Administration, the number of travelers passing through U.S. airport security checkpoints fell by 40 percent year over year (YoY) by mid-March and by 93 percent by the end of the month (Exhibit 3).
EXHIBIT 3: YEAR-OVER-YEAR CHANGE IN THE NUMBER OF TRAVELERS PASSING THROUGH U.S. AIRPORT SECURITY CHECKPOINTS, MARCH 1, 2020 – MAY 17, 2020
Source: U.S. Transportation Security Administration
Just as the full dimensions of the pandemic were emerging, a dispute between Saudi Arabia and Russia about limits on oil production helped push its price down from about $60 a barrel at the start of 2020 to about $20 a barrel by mid-March.
Although the two nations eventually reached an agreement on curtailing oil production, worldwide public health measures have limited manufacturing, transportation and travel, causing demand for oil to plummet. By late April, the price set for May deliveries of West Texas Intermediate crude oil — the world’s most actively traded oil contract and one of three main benchmarks in oil pricing, along with Brent and Dubai Crude — briefly fell negative on the New York Mercantile Exchange, hitting an all-time low of nearly -$40 per barrel.
In its most recent Short-Term Energy Outlook, the U.S. Energy Information Administration estimated that worldwide liquid fuels consumption will fall by an average of 8.1 million barrels a day throughout 2020.
To further compound matters, some companies in the energy sector were already facing financial difficulty before the first confirmed case of COVID-19. In 2019, 42 exploration and production companies filed for bankruptcy — and more could be on the way.
Recessions and Tax Revenues
The pandemic and energy sector downturn have spurred substantially different economic shocks than those of recent historical recessions, such as those prompted by the savings and loan crisis of the 1980s and 1990s, the dot-com bubble collapse and terrorist attacks of 2001 and the 2008 financial crisis. Even so, these periods can be used to illustrate how state tax collections are affected during downturns.
Year Over Year
The year-over-year comparison is a commonly used economic measure that compares growth in one period — generally a month or a quarter — with the same period in a previous or following year, such as January 2019 vs. January 2020. YoY comparisons remove the effect of seasonal fluctuations — for instance, the usual increase in sales tax collections following the Christmas holiday — and thus are useful for discerning long-term trends.
Texas state government relies heavily on tax collections to fund its functions. In fiscal 2019, Texas collected $59.4 billion in taxes, accounting for nearly half of the state’s total net revenue. Let’s look at taxes affected by past recessions — and those most likely to be affected significantly by the current economic disruption.
Sales and Use Taxes
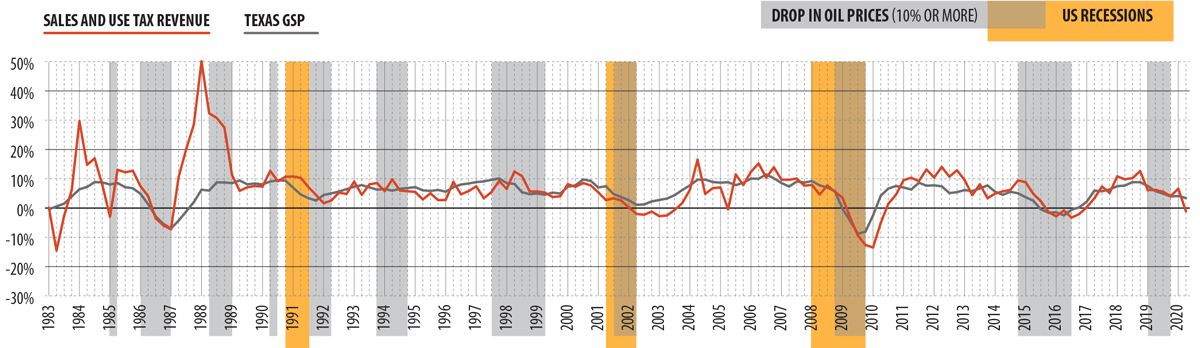
Texas’ general sales and use tax is the state’s largest and most critical source of tax revenue, accounting for 57.3 percent of total tax revenues in fiscal 2019. As our broadest tax, the sales tax generally follows fluctuations in the total state economy — our gross state product (GSP) — closely.
Exhibit 4 shows year-over-year growth in sales tax collections and Texas GSP, highlighting recent recessions and significant drops in oil prices (those greater than 10 percent). YoY changes in sales tax revenue and Texas GSP have mirrored one another except in the 1980s, when legislation changed the sales tax rate and tax base in response to a recession.
In the 1990s, a decade generally marked by robust economic growth, YoY changes in Texas’ monthly sales tax revenues remained positive throughout an early 1990s recession and most of the decade. During the 2000s, YoY declines in sales tax revenue occurred mostly after the 2001 recession ended, from January 2002 through August 2003. Revenues fell for 18 months out of this 20-month period, with an average decline of 1.7 percent.
EXHIBIT 4: YEAR-OVER-YEAR CHANGE IN SALES AND USE TAX REVENUE, FIRST QUARTER FISCAL 1983 – SECOND QUARTER FISCAL 2020
Note: In the late 1980s, large YoY changes in collections were caused by changes to the sales and use tax rate and tax base. The tax rate rose from 4 percent to 4.125 percent, effective October 1984; to 5.25 percent, effective January 1987; to 6.0 percent, effective October 1987; and to 6.25 percent, effective July 1990. The sales tax base was expanded through the repeal of selected exemptions and additions of taxable services in October 1987 and January 1988.
Sources: Texas Comptroller of Public Accounts, National Bureau of Economic Research and IHS Markit
Prior to the pandemic, the Great Recession was the only recent downturn to significantly affect collections. Texas sales tax collections declined by an average 9.5 percent over 14 consecutive months from February 2009 to March 2010. November 2009 marked the steepest one-month decline since September 1983, at 14.5 percent.
The Rainy Day Fund
State revenue stabilization funds, often called “rainy day funds,” are intended to allow states to set aside money in relatively good financial periods for use during economic downturns or emergencies. All states have some form of rainy day fund, but the terms of their use vary widely, as do their balances.
According to a recent report by the Tax Foundation, the median rainy day fund balance among states at the beginning of fiscal 2020 was equivalent to 8 percent of their general fund expenditures, considerably better than the 4.8 percent average recorded at the onset of the Great Recession in 2008. Two states, however, Illinois and Kansas, had little to nothing in their reserve funds ($4 million and zero, respectively). Several more — Arkansas, Kentucky, New Jersey and Pennsylvania — had balances equal to 3 percent or less of general expenditures.
By contrast, Texas’ rainy day fund, the Economic Stabilization Fund (ESF), will have a balance, net of appropriations, of $7.8 billion at the end of fiscal 2020. That’s equivalent to nearly 13 percent of annual general spending — and this amount is after multibillion-dollar draws used to support supplemental funding for fiscal 2019 and foster care, Medicaid expenses and Hurricane Harvey-related items in fiscal 2020. The Comptroller’s office expects that balance will be a little more than $8.5 billion by the time the Legislature convenes for its 2021 session.
The ESF was created by a November 1988 amendment to the Texas Constitution, following a recession linked largely to low oil prices. Until fiscal 2015, the rainy day fund received 75 percent of each year’s oil and natural gas production tax revenues in excess of the amounts they yielded in fiscal 1987 — $531.9 million for oil and $599.8 million for gas. In November 2014, a state constitutional amendment changed this allocation, making the ESF’s share one-half of the “excess” production taxes and sending the remainder to the State Highway Fund (SHF).
For more than a decade, the fund contained relatively small sums, with ending balances below $10 million in fiscal 1995 through 1997. The ESF didn’t achieve an ending balance in excess of $1 billion until 2007, reflecting the gradual revival of the Texas oil and gas industry driven by new “fracking” production methods. Thereafter, the ESF fund balance soared, finishing above $10 billion at the end of fiscal 2017, 2018 and 2019.
Before the 2019 legislative session, much of the ESF’s revenue was kept in relatively low-yield investments that barely kept pace with the general inflation rate. Legislation in that year allowed the Comptroller’s office to move up to 75 percent of the ESF into prudent but higher-yielding investments to maintain the state’s purchasing power. The agency has taken steps to preserve the liquidity of the fund for cash-flow borrowing and legislative appropriations.
Scheduled November 2020 transfers to ESF and SHF are likely to be smaller than the amounts projected in the 2020-21 Certification Revenue Estimate, released in October 2019, to an extent that cannot yet be reliably estimated but which could be significant. The Comptroller’s office expects to release an updated revenue estimate for fiscal 2020 and 2021 in July that will forecast this downward revision.
The extent of the reduction in revenues forecasted, and the extent to which amounts available for transfer to the ESF and SHF are likely to decrease, will depend on a number of factors, including to what extent Texas economic activity continues to be affected by COVID-19, the extent to which consumer confidence and economic activity rebound, changes in crude oil prices and exploration and development activity and other factors beyond the state’s control.
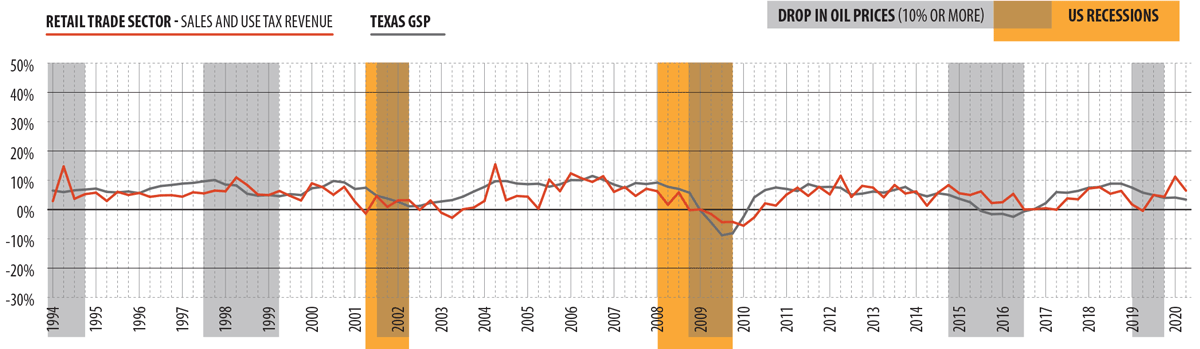
Sales tax revenue is driven primarily by collections from retail trade (Exhibit 5), which account for a recent average of about 36 percent of total sales tax revenue. Generally, tax revenue from sales of discretionary goods, such as personal electronics, tends to decline before and during recessions, and for obvious reasons — many consumers lose income or jobs, decreasing their ability or willingness to make such purchases.
EXHIBIT 5: YEAR-OVER-YEAR CHANGE IN SALES AND USE TAX REVENUE, RETAIL TRADE SECTOR, FOURTH QUARTER FISCAL 1993 — SECOND QUARTER FISCAL 2020
Sources: Texas Comptroller of Public Accounts, Bureau of Economic Research and IHS Markit
In prior recessions, falling sales tax collections lagged several months after the recession’s beginning. Now, however, we’re seeing immediate declines in revenues, due to the closing and reduced operation of many businesses.
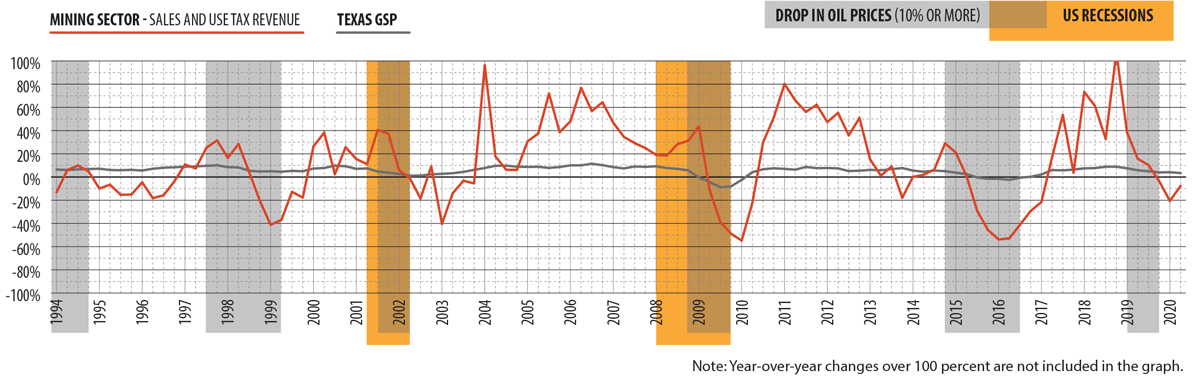
Extremely low oil prices also affect sales tax revenues. The most volatile component of the sales tax represents business spending on oil and gas mining equipment and supplies, which strongly correlates with energy prices (Exhibit 6).
EXHIBIT 6: YEAR-OVER-YEAR CHANGE IN SALES AND USE TAX REVENUE, MINING SECTOR, FOURTH QUARTER FISCAL 1993 – SECOND QUARTER FISCAL 2020
Sources: Texas Comptroller of Public Accounts, Bureau of Economic Research and IHS Markit
Motor Vehicle Sales and Rental Taxes
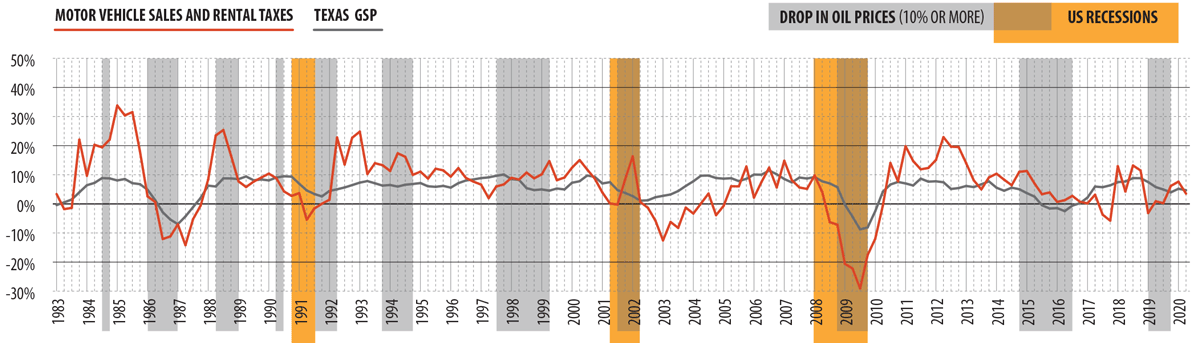
Motor vehicle sales and rental taxes provide Texas’ second largest source of tax revenue, accounting for 8.4 percent of total tax revenues in fiscal 2019.
While oil price increases can contribute to declines in auto sales, research from the Federal Reserve Bank of St. Louis indicates that declines in such sales tend to be more closely linked to changes in the overall economy (Exhibit 7).
EXHIBIT 7: YEAR-OVER-YEAR CHANGE IN MOTOR VEHICLE SALES AND RENTAL TAXES, FIRST QUARTER FISCAL 1983 – SECOND QUARTER FISCAL 2020
Note: Large YoY gains in collections occurred following increases in the Texas motor vehicle sales tax rate, which rose from 4.0 percent to 5.0 percent in 1984; to 6.0 percent in 1987; and to 6.25 percent in 1991. Collections also rose substantially immediately following the Great Recession, primarily due to pent-up demand for motor vehicles and low interest rates.
Sources: Texas Comptroller of Public Accounts, National Bureau of Economic Research and IHS Markit
Following the end of the 2001 recession, Texas’ motor vehicle sales and rental taxes sustained a full fiscal year of monthly declines (September 2002 to August 2003), averaging -8.4 percent. In the Great Recession, the auto industry was one of the hardest hit. In Texas, collections fell for 24 consecutive months from March 2008 to February 2010, averaging -14.9 percent over the period. The largest one-month decline since September 1982 occurred in the current recession, with April 2020’s fall of 44.7 percent.
Motor Fuels Taxes
Taxes levied on gasoline and diesel (as well as other fuels such as liquified and compressed petroleum gas) accounted for 6.3 percent of Texas tax dollars in fiscal 2019.
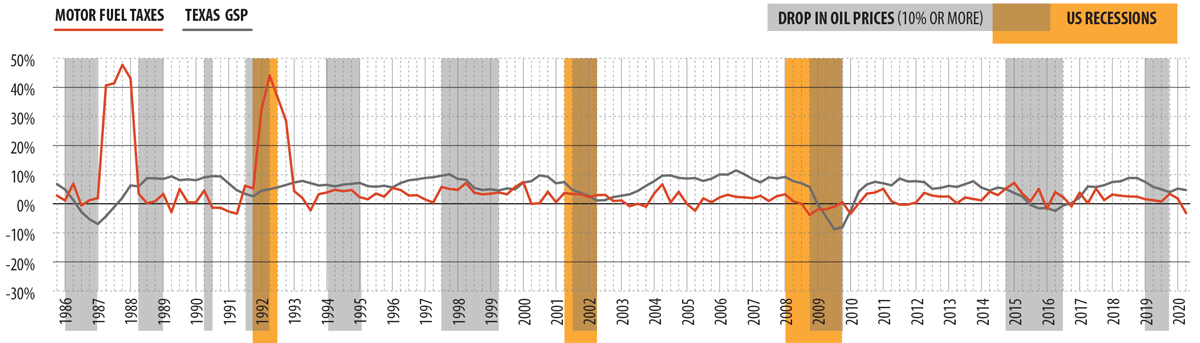
Diesel fuel is heavily used in commercial transportation, and its tax revenue is mostly affected by general economic conditions. Gasoline tax revenue, on the other hand, is more susceptible to changes in demographics and cultural attitudes, such as population shifts and attitudes toward commuting. Since diesel accounts for only about a quarter of motor fuels taxes, the impact of general economic conditions on motor fuel taxes is somewhat muted (Exhibit 8).
Of the three most recent recessions, the early 1990s saw the largest single-month YoY decline of motor fuel tax collections, -20.8 percent, in January 1991. The Great Recession sparked the longest streak of consecutive months of decline from November 2009 through March 2010, averaging -2.6 percent.
EXHIBIT 8: YEAR-OVER-YEAR CHANGE IN MOTOR FUEL TAXES, FOURTH QUARTER FISCAL 1985 – SECOND QUARTER FISCAL 2020
Note: Large YoY changes in collections occurred following rate changes for gasoline and diesel. The tax rate for both increased from 10 cents per gallon to 15 cents per gallon in 1987, and to 20 cents per gallon in 1991.
Sources: Texas Comptroller of Public Accounts, National Bureau of Economic Research and IHS Markit
Oil and Natural Gas Production Taxes
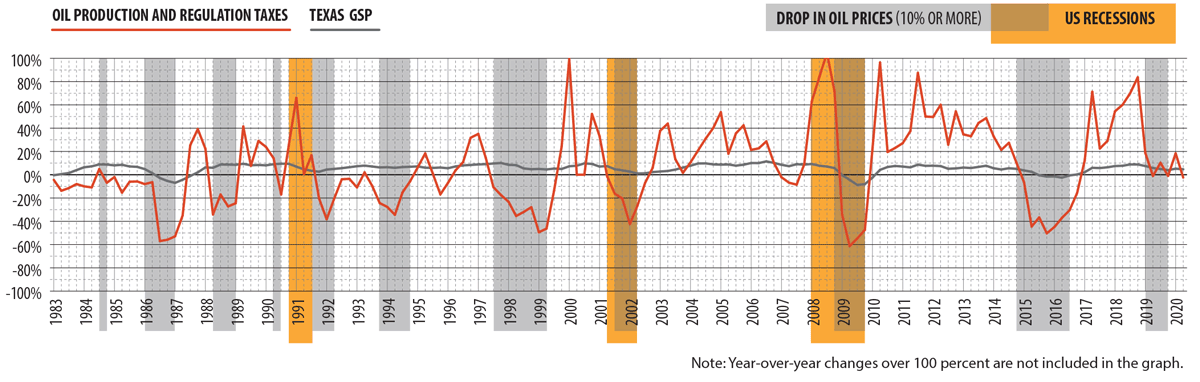
Oil production and regulation tax collections, which generated 6.5 percent of total tax revenue in fiscal 2019, are extremely volatile. (See our sidebar on the Texas Economic Stabilization Fund, the “Rainy Day Fund,” for greater detail on how severance tax collections affect the state treasury.)
Oil production, obviously, is most strongly influenced by changes in oil prices (Exhibit 9). The longest string of consecutive monthly YoY declines in recent Texas history occurred from December 2014 through October 2016, with an average decline of 34.3 percent. During the same period, oil prices declined by an average of 33.2 percent.
EXHIBIT 9: YEAR-OVER-YEAR CHANGE IN OIL PRODUCTION TAX, FIRST QUARTER FISCAL 1983 – SECOND QUARTER FISCAL 2020
Note: Exhibit also includes revenue from the oil regulation tax, which was repealed on September 1, 2015.
Sources: Texas Comptroller of Public Accounts, National Bureau of Economic Research, IHS Markit and U.S. Energy Information Administration
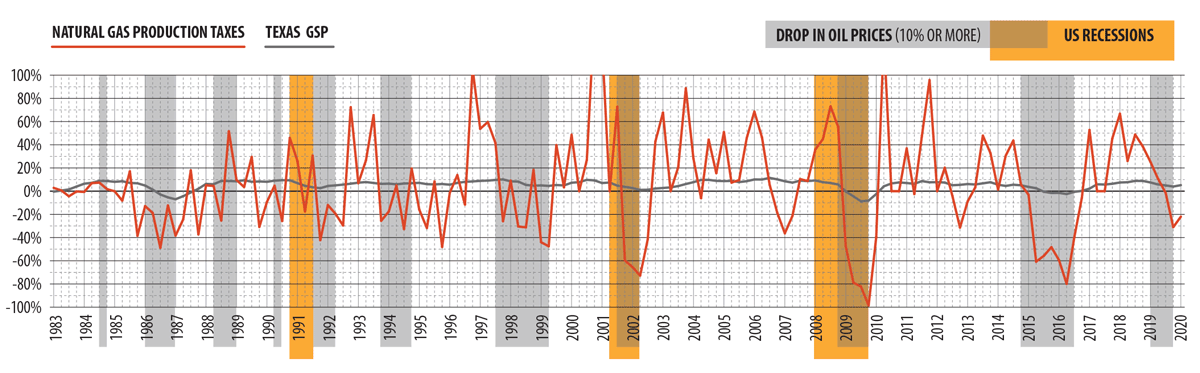
Oil prices and natural gas production also are interrelated (Exhibit 10). For instance, declines in oil prices can lead to decreased production of “associated gas” yielded by oil wells. Taxes levied on natural gas production accounted for 2.8 percent of total tax revenues in fiscal 2019. The longest recent streak of monthly YoY declines in natural gas production taxes — from November 2014 to September 2016 — coincided with long declines in oil production and regulation taxes. Over this 22-month period, collections declined by an average of 45.8 percent.
EXHIBIT 10: YEAR-OVER-YEAR CHANGE IN NATURAL GAS PRODUCTION TAX, FIRST QUARTER FISCAL 1983 – FIRST QUARTER FISCAL 2020
Note: YoY changes exceeding 100 percent are not included in the graph.
Sources: Texas Comptroller of Public Accounts, National Bureau of Economic Research, IHS Markit and U.S. Energy Information Administration
Hotel Occupancy Taxes
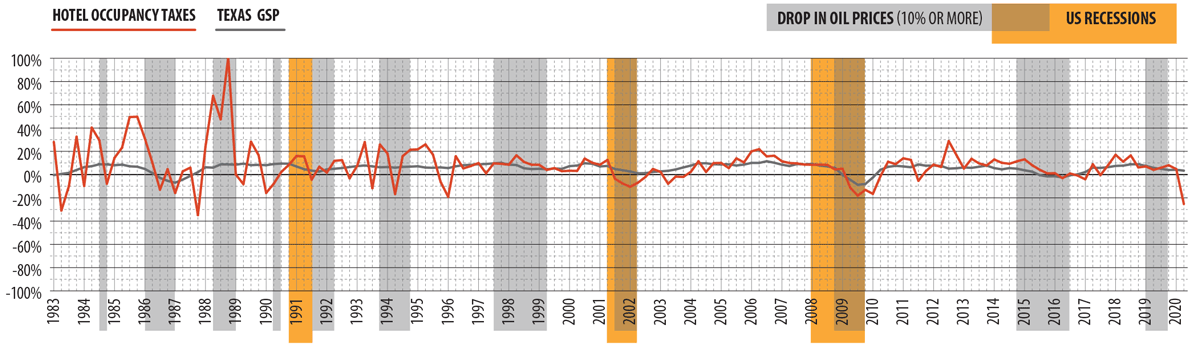
Hotel occupancy taxes account for a modest share of Texas’ total tax revenues (1.1 percent in fiscal 2019). But since hotels derive most of their income from consumers’ discretionary income, hotel occupancy tax revenues are highly susceptible to economic downturns (Exhibit 11). Revenue losses will be further compounded by a significant decline in business and leisure travel for the duration of the current pandemic. Until this year, the largest one-month YoY decline in hotel occupancy taxes (-27.8 percent) occurred two months after the September 11 terrorist attacks, which shut down much of the travel industry. April 2020 surpassed this record, with a 62.8 percent YoY decline.
EXHIBIT 11: YEAR-OVER-YEAR CHANGE IN HOTEL OCCUPANCY TAX FIRST QUARTER FISCAL 1983 – SECOND QUARTER FISCAL 2020
Note: YoY changes over 100 percent are not included in the graph. Large YoY changes in collections occurred following changes in the hotel occupancy tax rate, which rose from 3.0 percent to 4.0 percent in 1984 and to 6.0 percent in 1987.
Sources: Texas Comptroller of Public Accounts, National Bureau of Economic Research and IHS Markit
Bracing for Revenue Shortfalls
The Comptroller’s Fiscal 2020-21 Certification Revenue Estimate (CRE), released in October 2019, projected $121.8 billion available for general-purpose spending in the current biennium. The agency currently plans to release an updated estimate in July 2020.
Given the limited economic and epidemiological data currently available, it’s difficult to project the extent to which Texas’ revenue collections may decline, but it’s likely to be significantly deeper than those observed in other recent recessions. For now, the Comptroller’s office anticipates a downward revision to the CRE of at least several billion dollars.
For the current biennium, Texas has a number of tools to manage its cash flow in response to falling revenues. When the Legislature meets in 2021, legislators can consider policy responses and budget strategies to address any ongoing revenue shortfalls.
Exhibit 12 outlines Texas legislative responses to fiscal challenges posed by the Great Recession, which affected revenues in Texas later than in other states.
Make some funding contingent on improved revenue collections
$1.0
Subtotal, revenue solutions
$5.0
SPENDING SOLUTIONS AND RESPONSES
(IN BILLIONS)
Reduce entitlement funding to local school districts
$4.0
Defer August 2013 payment to school districts until September 2013
$2.3
Contain costs in Medicaid
$1.8
Underfund Medicaid in 2013
$4.3
Reduce other spending in the 2012–13 biennium
$5.2
Subtotal, spending solutions and responses
$17.6
Estimated gap between available revenue and current service demands
$27.0
Note: Totals may not sum due to rounding
Source: Legislative Budget Board
At present, the Texas economy will get its largest boost from federal aid, most notably from its share of the $2 trillion federal stimulus package funded through the Coronavirus Aid, Relief, and Economic Security Act of 2020. Unemployed workers and hard-hit businesses will receive the bulk of this funding (Exhibit 13).
EXHIBIT 13: CORONAVIRUS AID, RELIEF, AND ECONOMIC SECURITY ACT FUNDING
RECIPIENTS
TOTAL AMOUNT (IN BILLIONS)
SHARE OF TOTAL PACKAGE
Individuals/families
$603.7
30%
Big business*
$500.0
25%
Small business
$377.0
19%
State and local governments
$340.0
17%
Public services
$179.5
9%
*“Big” businesses under the act are defined as those with 500 or more employees.
Note: Nonprofit organizations, veterans organizations and businesses with fewer than 500 employees, as well as self-employed individuals and independent contractors, are eligible for small business relief.
Source: Visual Capitalist
Track other states’ responses to COVID-19 on the website of the Tax Foundation, an independent tax policy nonprofit organization.
Comptroller Response to Pandemic
By Michael Castellon
As COVID-19 spread, affecting much of Asia and Europe and then appearing on both U.S. coasts, it became apparent to officials at the Texas Comptroller’s office that it had the potential to disrupt its operations across the nation and affect the services it provides to Texas taxpayers, small businesses, industries and other state agencies.
The agency took action to secure its operations for staff and taxpayers. The first response included securing Comptroller facilities and ensuring the health of staff members. Precautions included an aggressive campaign for enhanced hygiene, sanitation and other methods for limiting an outbreak at any of the Comptroller’s facilities and field offices across the state and in cities around the nation.
Gauging the health of the agency’s information technology infrastructure also became paramount. Specifically, CPA tested the system’s ability to accommodate more than 2,500 employees connecting remotely with minimal disruption to taxpayers. Tests in mid-March proved successful, and an agencywide telework protocol began on March 16.
With staff and systems safely and securely protected and configured, agency officials could begin planning their response to the pandemic, which has resulted in a record number of jobless claims and disruptions affecting virtually every industry.
The agency quickly produced a COVID-19 Emergency Response webpage for taxpayers and notified thousands of them about the new resource via email. The page provides online tools and a tutorial and outlines a number of accommodations for taxpayers affected by COVID-19. We’re also reminding taxpayers that our Webfile system allows businesses to submit sales tax reports, make payments, change mailing addresses, close locations and more, 24/7. A new section of our emergency webpage contains information about stimulus initiatives available to local governments.
The agency has attempted to ease the burden on Texas taxpayers as much as possible within the context of state law. We’ve extended the due date for 2020 franchise tax reports to July 15 to be consistent with IRS deadlines. We’re offering extensions of up to 90 days to pay motor vehicle sales taxes due. For businesses struggling to remit the sales taxes they collect, we’re offering short-term payment agreements and, in most instances, waivers of penalties and interest.
For Audit operations, we’ve temporarily suspended the 60-day deadline to contest audit results, both for redetermination and refund hearings. The agency also is waiving interest accrued during this period and notifying businesses to reestablish a request deadline at a later date.
Local government officials are encouraged to use the Comptroller’s online resources to become familiar with the Coronavirus Relief Fund, Municipal Liquidity Facility and Commercial Paper Funding Facility as opportunities to secure stimulus funding for their communities.
See a detailed list of Comptroller responses to COVID-19 and a list of local government stimulus initiatives online.


 A REVIEW OF THE TEXAS ECONOMY