The 2020 economic recession and its subsequent recovery were unlike any previous economic downturn. The extraordinary efforts to contain the coronavirus — from stay-at-home orders to business and school closures — led to staggering initial economic losses. According to the U.S. Bureau of Economic Analysis (BEA), gross domestic product (GDP) fell by annualized rates of 37.9 percent in Texas and 32.4 percent in the U.S. between the second and third quarters of 2020. As the economy reopened, Texas and U.S. GDP rebounded by 45.3 percent and 38.7 percent, respectively, between the third and fourth quarters.
Movie ticket sales offer real-time data on the economy.
The pandemic’s effect on jobs revealed a similar story. The U.S. Bureau of Labor Statistics found that Texas employment levels fell by 11.2 percent (1.5 million jobs) in just two months between February and April 2020. These job losses were much faster and deeper than previous recessions. Yet, like the GDP rebound, the jobs recovery was accelerated compared to past economic downturns. In November 2021, Texas employment levels reached pre-pandemic highs, 21 months after initial job losses. The Texas jobs recovery in the Great Recession of 2008, by comparison, required 39 months to recover lost jobs (Exhibit 1).
Exhibit 1: Texas Job Losses in Recent Recessions as a Share of Employment; U.S. Job Losses in 2020 Recession
Sources: U.S. Bureau of Labor Statistics; Texas Comptroller of Public Accounts
In terms of losses and recovery, the 2020 recession resembled a recession caused by a natural disaster more than a typical recession caused by business cycle fluctuations. “It was as if a hurricane or earthquake hit the country all at once,” says Keith Phillips, an economist recently retired from the Federal Reserve Bank of Dallas.
The relatively fast economic recovery was aided by an unprecedented emergency response from the federal government, including enhanced unemployment benefits, direct payments to individuals and families and loans to businesses.
High-Frequency Data Offer Timely Perspective on Texas
With the unprecedented drop in the economy and employment, Comptroller Glenn Hegar and his staff needed real-time data to provide guidance to the public and legislators who were desperate to learn the magnitude of the economic events consuming our lives. Hegar explains:
In the beginning of the pandemic, people were very nervous and near the edge of panic. I needed real-time data so I could first remind everyone that Texas entered the pandemic in a very strong economic position, and then to convey what we knew and were seeing. The data showed that certain industries faced unprecedented challenges, while for a variety of factors, other industries were better able to manage the crisis. High-frequency data points gave us real-time facts and data to tell the story of the economy as we saw it unfolding. Even with this data, we regularly reminded everyone that we needed a few more months of data to provide an indication of the future trajectory of the Texas economy.
While some of those data points were very grim, others told the story that Texas would get through this challenge. We still use this information today, even as the economy continues its recovery, because it helps show trends and gives me real data to tell the story of our remarkable entrepreneurs, as well as helps provide a snapshot of the Texas economy in real time.
Economists and policymakers around the nation also turned to high-frequency data — that is, data that are available more often than monthly data — to track the rapidly changing developments of the pandemic. In this environment, traditional measures of economic health — monthly jobs reports or quarterly GDP reports — were outdated upon release. The real-time analysis, as noted by Hegar, helped inform policy responses and efficiently target those impacted by the recession.
High-frequency data from government sources also proved very useful in assessing the severity of the pandemic and the nature of the recovery. One of the most closely watched indicators was the tally of weekly unemployment insurance claims. Texas’ weekly claims spiked to more than 315,000 in early April 2020. Compared to the January/February 2020 average, the number of claims gradually decreased but remained elevated until October 2021 (Exhibit 2).
Note: Not seasonally adjusted. Source: U.S. Department of Labor
Economists also monitored airline travel data from the U.S. Transportation Security Administration (TSA) to track the health of the airline industry and the public’s willingness to travel during the pandemic. Following a precipitous drop, passenger levels gradually rebounded. At the end of 2021, however, passenger travel remained about 20 percent below the same period in 2019 (Exhibit 3).
Exhibit 3: TSA Throughput, Change in Daily Checked Travelers
Source: U.S. Transportation Security Administration
More Examples of High-Frequency Data
The recent emergence of high-frequency data for measuring economic strength comes largely from private companies. These data are used to track aspects of the economy that include movements in consumer spending, mobility, job openings, infections and lockdown measures before “official” government data are published.
Opportunity Insights, a research organization at Harvard University, launched its real-time Economic Tracker in May 2020 to assist policymakers in understanding the scope of the downturn and to inform recovery efforts. The tracker incorporates several high-frequency data sets and harnesses big data capabilities (see inset box) to produce highly granular analyses.
Big data describes data sets that are far too large and complex to analyze with traditional data analysis methods. Some main characteristics of big data include massive volume (millions or trillions of records), the speed at which information is generated and processed (within seconds or days) and data type (structured/unstructured, numeric/text, audio/video, etc.). Companies mine big data for many reasons, including to better understand customers, target marketing efforts, manage fraud and similar risks and address supply chain issues.
Sources: SAS Institute Inc.; Forbes
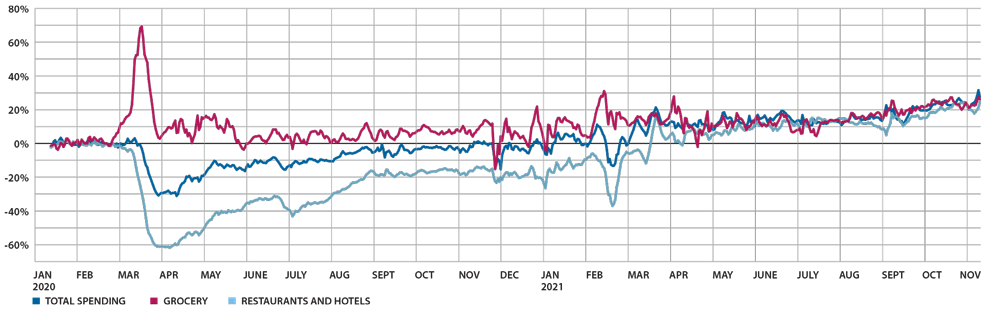
The tracker, for example, uses data from Affinity Solutions, which provides daily purchase data from consumer credit and debit card spending and offers an array of insights into consumer spending. Spending data are seasonally adjusted and can be traced to types of merchants, including apparel and general merchandise, entertainment and recreation, grocery, health care, restaurants and hotels and transportation. In addition, transactions are linked to ZIP codes, allowing Affinity to impute spending by levels of median household income.
Opportunity Insights’ Economic Tracker allows users to explore the economic downturn and recovery by those industry and income categories. Exhibit 4 illustrates how spending varied widely by type of industry at the onset of the pandemic, including a precipitous drop at restaurants and a sharp increase at grocery stores. For the week ending Nov. 14, 2021, total consumer spending was up 27.5 percent in Texas compared to Jan. 15, 2020.
Google provides COVID-19 Community Mobility Reports that chart people’s movements outside the home. The reports show daily movement trends over time by geography and across different destinations, such as parks, grocery stores, retail and restaurants, transit and workplaces. These trends illuminate behavioral changes and inform public health officials and policymakers, especially as trends relate to surges in COVID-19 cases and to policies aimed at combating the virus.
Opportunity Insights also incorporates the mobility data into its tracker. Exhibit 5 shows that Texans’ time spent outside the home has not reached the same levels as in pre-pandemic January 2020. Importantly, the tracker highlights decreases in mobility that coincide with surges in COVID-19 cases, including the latest omicron surge, as well as a decrease in February 2021 due to Winter Storm Uri.
Exhibit 4: Percent Change in Consumer Spending, Compared to January 2020
Sources: Affinity Solutions; Opportunity Insights
Exhibit 5: Percent Change in Time Spent Outside Home, Texas
Sources: Google COVID-19 Community Mobility Reports; Opportunity Insights
Restaurants and entertainment incurred huge economic losses during the pandemic, and high-frequency data were used to track their fallout as well. In March 2020, OpenTable, the online restaurant reservation service, launched a State of the Industry site. It demonstrates how the pandemic impacted restaurants across the globe, including in U.S. states and cities. For entertainment, Box Office Mojo provides daily and weekly U.S. movie box office receipts.
These two data sets produced some of the most astounding developments of the pandemic, as restaurant reservations and movie theater receipts fell by 100 percent in March 2020. OpenTable reservations didn’t return to pre-pandemic levels until March 2021.
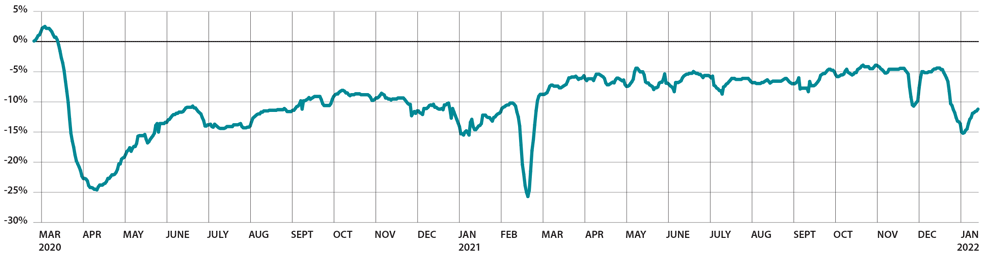
High-frequency data have been used to track hotel stays as well. Data from STR — an analytics firm and hospitality industry consultant — reveal the pandemic’s detrimental effects on the U.S. hotel industry. Hotel occupancy rates fell by nearly 70 percent early in the pandemic. Only in recent months have hotel stays approached comparable pre-pandemic levels (Exhibit 6).
Exhibit 6: Change in Weekly Hotel Occupancy
Source: STR
Use With Care
High-frequency data are highly useful in providing timely analysis of COVID-19’s impact on public health and the economy. The data sets provide detailed insights into the types of people and industries most affected by the recession and the areas of the U.S. most deeply impacted.
These data, however, are just one piece of the puzzle in the vast economic landscape. The limitations of high-frequency data must be considered, including data samples that are biased, not seasonally adjusted or are benchmarked to a single day, week or month. Any one of those characteristics can lead to consumers misinterpreting trends.
Google’s mobility reports, for example, only report data from Google users who have enabled the Location History setting. OpenTable only tracks reservations for seated restaurant dining and does not track orders to go. OpenTable also does not account for restaurants that permanently closed during the pandemic.
Looking only at the real-time restaurant reservation data could distract from key developments within the restaurant industry. For instance, sales tax data from the Texas Comptroller in May 2020 showed steep drops in overall collections from restaurants but large increases in receipts from restaurants that could easily pivot to takeout and delivery services.
“High-frequency data provide a valuable perception of consumer behavior,” says Brad Reynolds, chief revenue estimator at the Texas Comptroller’s office. “As the restaurant delivery and takeout experience demonstrate, these data should be interpreted along with other pertinent data.”
Looking Ahead
High-frequency data usage emerged by necessity to track the fallout from COVID-19 in real time. It provided useful, early insights into people’s behaviors and spending habits and continues to help monitor the economic recovery.
As economists and policymakers return to conventional indicators, the most critical high-frequency data variables may be those tied to public health outcomes. Data on daily COVID cases and hospitalizations may reveal the first indicators of a return to normalcy in public health, and other economic data may follow. FN
To learn more about economic recoveries, watch the Line Items video, “The Recovery After a Recession” — episode one in the new Fiscal Notes series, “It’s Simple. Kind of.”