Since 1790, the federal government has embarked on an enormous task every 10 years: to count every man, woman and child living in the U.S. This decennial census is vitally important to governments throughout the nation: Its data determine how more than a trillion dollars in federal funds will be allocated each year.
Literally hundreds of federal programs and most federal funding rely on data collected in the decennial census, and the fair and equitable allocation of these funds depends largely on a complete and accurate population count.
Census-Guided Federal Funding
Most federal spending programs allocate funding based on complex formulas and multiple variables, but many depend on annually updated datasets derived from the decennial census. For this reason, its role in the distribution of federal funding is crucial. The George Washington Institute of Public Policy has identified 316 federal spending programs that used state and local data derived from the decennial census to allocate $1.5 trillion to states, communities, households, businesses and nonprofits in the 2017 federal fiscal year.
In a separate analysis, the institute compiled state-specific numbers for fiscal 2016 (Exhibit 1). The 10 largest census-guided programs distributed nearly $44 billion to Texas in that year.
Exhibit 1: Census-Guided Federal Financial Assistance Programs to Texas, Top 10 by Funding, Federal Fiscal Year 2016
Program
Amount
Federal Department
Types of Recipients
Type of Financial Assistance
Medical Assistance Program (Medicaid)
$23,696,453,000
Health and Human Services
States
Grant
Supplemental Nutrition Assistance Program
$5,308,544,560
Agriculture
Households
Direct Payment
Medicare Supplemental Medical Insurance (Part B)
$4,649,954,126
Health and Human Services
Households
Direct Payment
Highway Planning and Construction
$3,330,264,684
Transportation
States
Grant
National School Lunch Program
$1,444,300,000
Agriculture
States
Grant
Title I Grants to Local Education Agencies
$1,367,579,292
Education
States
Grant
State Children's Health Insurance Program
$1,345,138,000
Health and Human Services
States
Grant
Section 8 Housing Choice Vouchers
$1,045,058,000
Housing and Urban Development
Households
Direct Payment
Special Education Grants
$1,022,593,712
Education
States
Grant
Head Start
$691,648,948
Health and Human Services
Service Providers
Grant
Note: Figures exclude student loans and Pell grants, which depend on national census data but not on state and local results.
Source: Prepared by Andrew Reamer, George Washington Institute of Public Policy; spending data research by Sean Moulton, Project on Government Oversight, May 2019
These studies have identified 52 census-derived datasets used to distribute federal funding. They fall into three interdependent categories:
Population estimates: Congress allocates funds based on annual population estimates conducted by the U.S. Census Bureau. This Population Estimates program essentially updates the decennial census each year while focusing on the same variables, such as age, sex, race and ethnicity. Among their many uses, these figures are used to determine an area’s per-capita income, a key variable that determines funding allocation and eligibility for some of the largest federal spending programs, including federal reimbursements to states for Medicaid expenditures.
Household surveys: These surveys use the decennial census and annual population estimates to determine how to sample households in the U.S. The most widely used survey is the Census Bureau’s American Community Survey (ACS), which measures the characteristics of people across areas, including education and income levels, commuting habits and many other characteristics of how people work and live. Many federal programs use customized datasets drawn from the ACS, such as the Small Area Income and Poverty Estimates that guide federal grants to school districts with high shares of low-income children.
Geographic classifications: The decennial census also is used to calculate population density, which is how the Census Bureau determines rural and urban designations and defines metropolitan and “micropolitan” areas. Many federal programs use such geographical designations to determine eligibility for funding.
All of these programs use data derived from census results — and rely, therefore, on the accuracy of census counts, although their sensitivity to census accuracy varies. Programs that allocate funds to states and local areas by a population-driven formula, such as a state or local share of total population, are the most sensitive to census results.
Exhibit 2 lists some large federal programs that use local population figures to guide the distribution of federal funds — and thus are among the most sensitive to census accuracy. Various datasets are used to count the target populations, but all program datasets use the decennial census as their statistical foundation.
Exhibit 2: Large Census-Guided Programs with State/Local Share Funding Formulas
Federal Program
2016 Funding in Texas
Federal Department
Recipient
Title I Grants to Local Education Agencies
$1,367,579,292
Education
States
Special Education Grants
$1,022,593,712
Education
States
Vocational Rehabilitation Grants to the States
$243,139,628
Education
States
Community Development Block Grants/Entitlement Grants
$155,604,467
Housing and Urban Development
Cities, Counties
Social Services Block Grant
$133,200,657
Health and Human Services
States
Career and Technical Education - Basic Grants to States
$92,298,374
Education
States
Special Nutrition Services for the Aging
$43,239,708
Health and Human Services
States
Source: Programs identified by George Washington Institute of Public Policy; spending data research by Sean Moulton, Project on Government Oversight
The Cost of Undercounts
Given its financial importance, jurisdictions throughout the U.S. have a common interest in ensuring that all U.S. residents are counted.
The complex funding formulas and eligibility requirements of many federal programs make it impossible to estimate the total costs of an undercount. Some formulas, however, have a single key population variable that drives funding and thus allows for estimates of financial losses per each person missed in the census. One such program is Medicaid, the largest federal grant program for states.
A George Washington Institute analysis shows that a 1 percent undercount in the 2010 decennial census would have resulted in a loss of nearly $300 million annually in federal funds to Texas, or $1,161 per person missed. This theoretical loss would have occurred in funding for Medicaid and four smaller U.S. Health and Human Services programs that rely on the Federal Medical Assistance Percentage (FMAP) formula, which measures a state’s per capita income (PCI) compared to the U.S. average and determines the federal reimbursement rate for a state’s program expenditures. The lower a state’s PCI is compared to the nation’s, the higher its FMAP score and thus the greater its federal reimbursement rate.
Since PCI is simply an area’s total personal income divided by the Census Bureau’s annual population estimates, an undercount increases the area’s PCI and reduces its FMAP score, resulting in the loss of federal funds. A Census Bureau follow-up study of the 2010 census indicates that Texas undercounted its total population by 0.97 percent.
The Census and Education Dollars
The FMAP programs highlight the financial implications of an undercount to total population. Other programs that target population subsets depend on who is counted accurately.
In 2016, Texas received nearly $1.4 billion in Title I Grants to Local Education Agencies, which support educational services at schools and school districts with high levels of children living in poverty. The distribution of these funds is determined by formula, but the amount of funds each area is eligible to receive is driven by a single variable: its share of children from low-income families aged 5 to 17.
If an economically disadvantaged child is missed in the local census count, those funds will go to other areas. An analysis (PDF) by the Project on Government Oversight and the George Washington Institute estimates that missing one of these children in the decennial census costs U.S. school districts an average of $1,695 annually.
And since the annual population estimates are based on the decennial census, any miscount persists.
“If you miss these kids now, you miss them for the whole decade,” says Cassie Davis of the Center for Public Policy Priorities. “The census count is used for statistical projections of population and to know how many people to survey in other surveys, like ACS, so if the count is off, it’s all off. Kids will still be going to school, but they will be missed or underrepresented in the funding allocation.”
Census Challenges
Texas’ rapid population growth in itself poses a difficulty for the census count. The Census Bureau’s annual updates show that Texas added 3.6 million people from 2010 to 2018 — nearly 20 percent of all U.S. population growth. This means lots of new addresses and living arrangements that must be noted.
Another issue involves internet access. The 2020 census will be the first to accept online answers to census questions, a move intended to reduce paperwork expenses and improve participation. Yet more than 2 million Texas households can’t access high-speed internet, an increasingly basic requirement for online participation in our society.
Still another challenge is the difficulty of counting certain populations. Racial and ethnic minorities and poor households are at greater risk of not being counted in the census. An analysis of the 2010 census (PDF) performed by the advocacy group Funders Committee for Civic Participation, for example, estimated that the non-Hispanic black population was undercounted nationally by 2.06 percent. Such undercounts result in misallocated political representation and governmental resources and hinder the development of underserved areas.
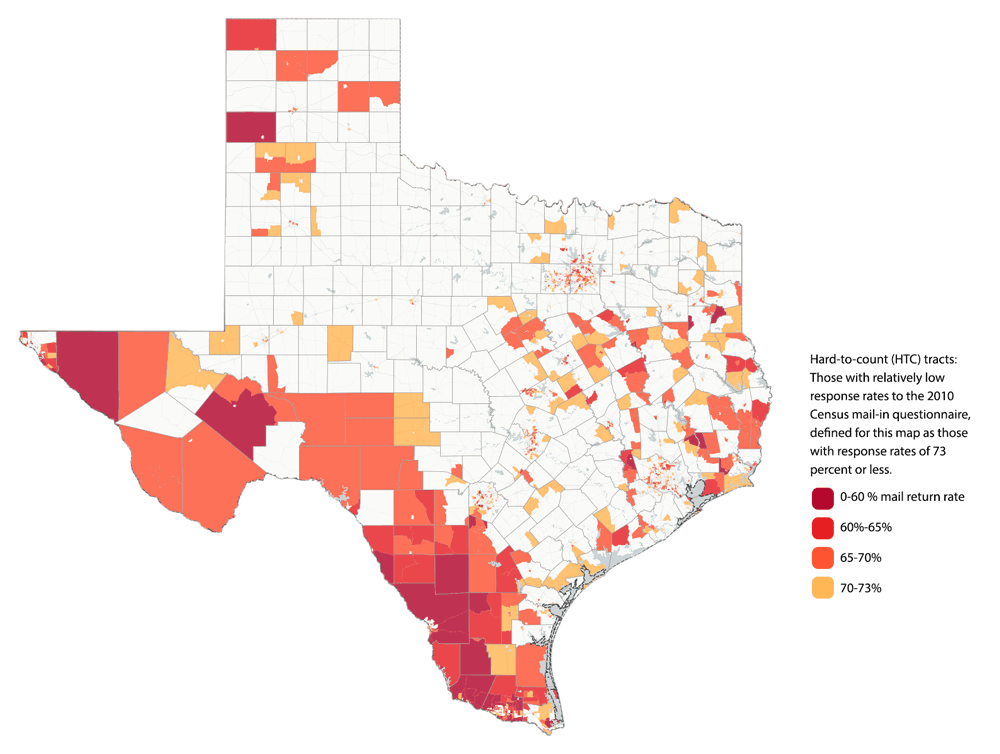
According to City University of New York’s Center for Urban Research (PDF), 6.9 million Texans — about 25 percent of the state’s total population — live in hard-to-count (HTC) neighborhoods (Exhibit 3). The Census Bureau defines HTCs as census tracts (statistical subdivisions within each county) with relatively low response rates to the mail-in census questionnaire.
Exhibit 3: Hard-to-Count Areas in Texas
Hard-to-count (HTC) tracts: Those with relatively low response rates to the 2010 Census mail-in questionnaire, defined for this map as those with response rates of 73 percent or less.
Texas has relatively high shares of populations that have been missed in previous census counts at disproportionately high rates, including minorities, children below the age of five, the foreign-born and low-income populations (Exhibit 4). About 30 percent of children under age five live in HTC neighborhoods.
Exhibit 4: Populations at Risk of Being Undercounted
(Share of Total Population)
Populations
US
Texas
Persons of color
38.5%
57.1%
Children under 5
6.2
7.2
Renters
36.2
38.0
Crowded households*
3.3
4.9
Single-Parent Households
10.8
12.5
Foreign-Born Populations
13.4
16.9
Low-Income Populations (below poverty level)
14.6
16.0
People with Limited English Proficiency
4.5
7.9
People Living in Multi-Family Housing
26.1
24.7
*Crowded households are defined as those with more members than rooms.
Source: City University of New York Center for Urban Research
A related hurdle concerns public reluctance to be identified on the census, traditionally a problem in communities with large numbers of immigrants. According to the Texas Demographic Center (PDF), nearly 4.5 million Texas residents were born in a foreign country. The nonpartisan American Immigration Council has reported that, between 2010 and 2014, 2.7 million Texas residents “lived with at least one undocumented family member.”
Thirty-nine states have created statewide complete count committees (CCCs) to assist community groups in reaching out to traditional HTC populations to help ensure they are reported in the census; 23 have appropriated state funds for CCC efforts. While Texas has not created a statewide CCC, Texas’ largest cities all have established CCCs of their own. In addition, a nonprofit consortium called Texas Counts, which represents dozens of community, local government and business groups, is assisting local CCCs in their efforts.
According to Texas Secretary of State Ruth Hughs, the state’s primary goal is to count all Texans and ensure the accuracy of the count.
“The census plays a major role in determining the distribution of federal funds to the Lone Star State in areas such as health care, education, agriculture and infrastructure and housing, as well as determining the size of our congressional delegation,” Hughs says. “That’s why it’s imperative that we work collaboratively towards finding ways to help ensure we count all Texans in the upcoming census.” FN


 A REVIEW OF THE TEXAS ECONOMY