
Top navigation skipped

The Texas Economic Stabilization Fund Saving for Rainy Days
Note: this article originally appeared in the September 2016 issue of Fiscal Notes. We have updated it to increase its usefulness to Texas taxpayers and state lawmakers currently meeting in the 2017 legislative session.
— The editor
Texas has the nation’s largest economic stabilization fund (ESF), commonly called a “rainy day fund.”
The state’s ESF balance at the close of fiscal 2016 was $9.7 billion. According to a recent study by the National Association of State Budget Officers (NASBO), that’s equivalent to about 18 percent of Texas’ annual general revenue expenditures, nearly three times more than a nationwide average of 6.5 percent among states with similar funds.
If the 2017 legislative session doesn’t tap the rainy day fund, it should contain about $10.3 billion by the end of fiscal 2017 and $11.9 billion at the end of fiscal 2019.
Funding the Fund
The Pew Charitable Trusts report that 46 states have some form of rainy day fund.
Texas had the nation’s second-largest rainy day fund in fiscal 2015 and the largest in 2016 (Exhibit 1).
Exhibit 1: Largest State Rainy Day Funds, Fiscal 2015 and 2016
| State | Fiscal 2015 Balance | Fiscal 2016 Balance |
|---|---|---|
| TEXAS | $8,460 | $9,715 |
| California | $4,339 | $8,661 |
| Alaska | $10,314 | $6,881 |
| Ohio | $1,478 | $2,005 |
| Georgia | $1,431 | N/A |
| Minnesota | $1,344 | $1,947 |
| New York | $1,798 | $1,798 |
| Florida | $1,139 | $1,354 |
| Indiana | $1,254 | $1,317 |
| Massachusetts | $1,252 | $1,258 |
Source: National Association of State Budget Officers, The Fiscal Survey of States, Spring 2016, and Texas Comptroller of Public Accounts
Texans approved a constitutional amendment creating the ESF in 1988, following an oil price plunge and economic recession that forced lawmakers to raise taxes to keep state government in the black. The Legislature structured the fund to automatically set aside some tax revenues in boom years to help the state during downturns. Subsequent legislation and another constitutional amendment made further changes to its funding mechanisms.
The crude oil and natural gas production taxes are by far the most important funding sources for the fund, contributing more than 85 percent of its revenue over time. Ironically, the state has amassed its substantial cushion by tapping the same volatile revenue stream that has caused it financial difficulties in the past.
Until fiscal 2015, the rainy day fund received 75 percent of each year’s oil and natural gas production tax revenues in excess of the amounts they yielded in fiscal 1987 — $531.9 million for oil and $599.8 million for gas. In fiscal 2015, despite faltering energy prices and production, these taxes yielded nearly $2.9 billion and $1.3 billion, respectively. In fiscal 2016, by contrast, the oil production tax brought in just $1.7 billion; the natural gas tax didn’t reach the 1987 threshold for an ESF transfer.
A November 2014 constitutional amendment shifted half of the ESF’s share of oil and gas tax revenue to the State Highway Fund to address urgent transportation needs. Without further legislative action, this arrangement will end in December 2024, and the fund’s share will return to 75 percent of oil and gas tax collections above the fiscal 1987 threshold in fiscal 2026.
Other rainy-day revenue includes half of any unencumbered balance in general revenue (that is, revenue not reserved for any specific purpose) at the end of each biennium, and all interest earned on the balance and investments made with it. The Legislature also may make direct appropriations to the fund, although it has never done so.
Money Rolls In… and Out
Since its inception through February 2017, the rainy day fund has received deposits of $19.9 billion and earned $832.4 million in interest.
The Comptroller’s office has up to 90 days after the end of each fiscal year to transfer revenue to the fund; typically, these are made in late November. The agency’s most recent transfer, in November 2016, totaled about $439.5 million, with an identical sum transferred on the same day to the State Highway Fund.
The Texas Constitution authorizes the Legislature to make appropriations from the ESF in response to three circumstances:
- a budget deficit during a biennium;
- a projected revenue shortfall in an ensuing biennium; or
- any other purpose the Legislature chooses at any time.
Appropriations for the first two circumstances require approval by three-fifths of the Legislature, while a general-purpose appropriation needs a two-thirds majority for passage.
The Legislature has made seven appropriations totaling $10.6 billion from the ESF since its inception, most recently in 2013. All were approved by two-thirds votes. The purposes for these appropriations have included water projects, disaster relief, public education, economic development and health and human services. Only one appropriation — $3.2 billion in 2011, representing 34 percent of the fund balance — was made to cover a budget gap (for fiscal 2011).
History in the Balance
In the 1990s, the fund’s year-end balance exceeded $100 million only once. The Legislature tapped the rainy day fund three times during that decade, each time exhausting almost the entire balance. After an appropriation to address school finance in 2005, the fund balance was reduced to $7 million.
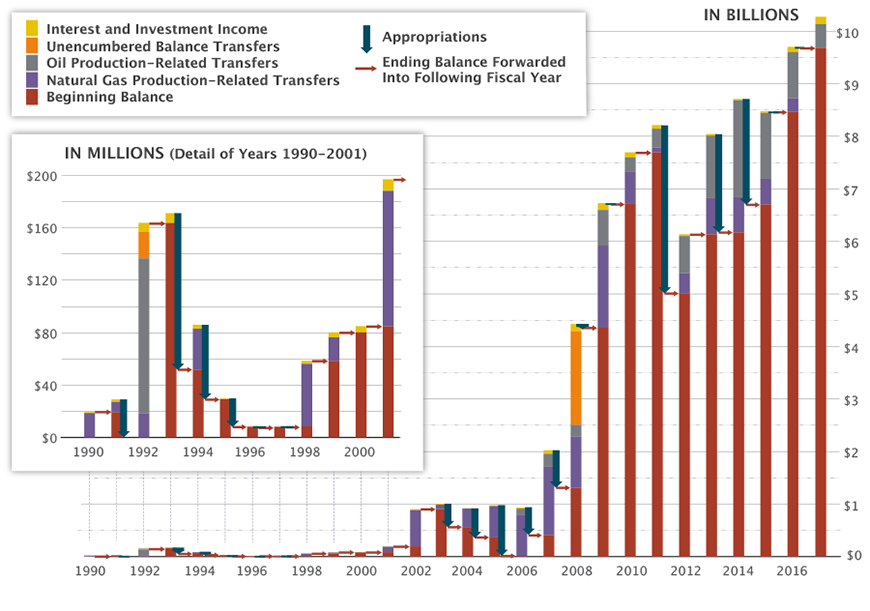
The ESF’s huge balance today is due mainly to extraordinary growth in oil and gas tax collections during the recent shale boom. In fiscal 2006, it received its first revenue transfer based on the oil production tax since 1992; natural gas taxes also skyrocketed that year, responding to the surge in production based on hydraulic fracturing (“fracking”) technology. Oil and gas taxes have contributed to the rainy day fund every year since 2006 (Exhibits 2 and 3).
Exhibit 2: Economic Stabilization Fund Revenue and Expenditure History with Ending Balances
Source: Texas Comptroller of Public Accounts
Maximum, Minimum
The state’s constitution limits the ESF’s maximum balance in each biennium to no more than 10 percent of the amount of general revenue deposited during the preceding biennium. (Interest and investment income and interfund borrowing are excluded from this cap.)
In practice, maximum ESF balances have never come close to the cap amount. The cap for the current biennium (fiscal 2016 and 2017) is $16.1 billion and is estimated at $16.9 billion for the next biennium.
The November 2014 constitutional amendment that redirected a portion of oil and gas tax revenue to the State Highway Fund also included a requirement that the ESF retain a “sufficient” amount on hand. Neither the state constitution nor state law specify what this amount should be, however.
Instead, this “sufficient fund balance” is determined prior to each regular legislative session by a joint select committee and submitted to the Legislature. The Legislature may set a different number, but otherwise the committee’s figure takes effect.
The sufficient fund balance is set at $7 billion through the end of the 2016-17 biennium and at $7.5 billion for the 2018-19 biennium.
Investments
Throughout most of its history, the Texas Treasury Safekeeping Trust Company, a special-purpose entity chaired by the comptroller, has invested rainy day fund revenue in short-term, low-yield, highly liquid instruments, to keep the funds readily available if needed.
To maintain the ESF’s purchasing power in an era of historically low interest rates, however, the 2015 Legislature authorized the Trust Company to invest the portion of the ESF balance above the sufficient fund balance through its Texas Economic Stabilization Investment Fund.
This investment fund is intended to provide safe returns and prevent the erosion of the ESF’s purchasing power due to inflation. It’s subject to a “prudent investor standard” and must be maintained so the balance is adequate to meet cash-flow requirements. Currently, the Trust Company is investing a majority of ESF revenue above the sufficient fund balance through this fund. This enhanced investment authority expires on Dec. 31, 2024.
In fiscal 2016, the Trust Company invested about $2.6 billion in this way, producing a net return of about $54.7 million for the ESF in that year.
Paying It (or Saving It) Forward
The Texas economy has proven its resilience after the recent fall in oil prices, a situation much improved from the 1980s oil and real estate busts that spurred the rainy day fund’s creation. Texas is faring far better financially than other states with large mining and energy sectors, such as Oklahoma, Louisiana and North Dakota.
Our state still faces significant challenges, however. State revenue growth has slowed, while financial strains on our infrastructure persist. State leaders face pressure to use the rainy day fund for obligations such as employee pensions, foster care, health benefits for retired teachers and deferred maintenance.
The size of the rainy day fund, coupled with the state’s latest funding challenges, have made it a topic of lively debate in the 2017 legislative session. FN